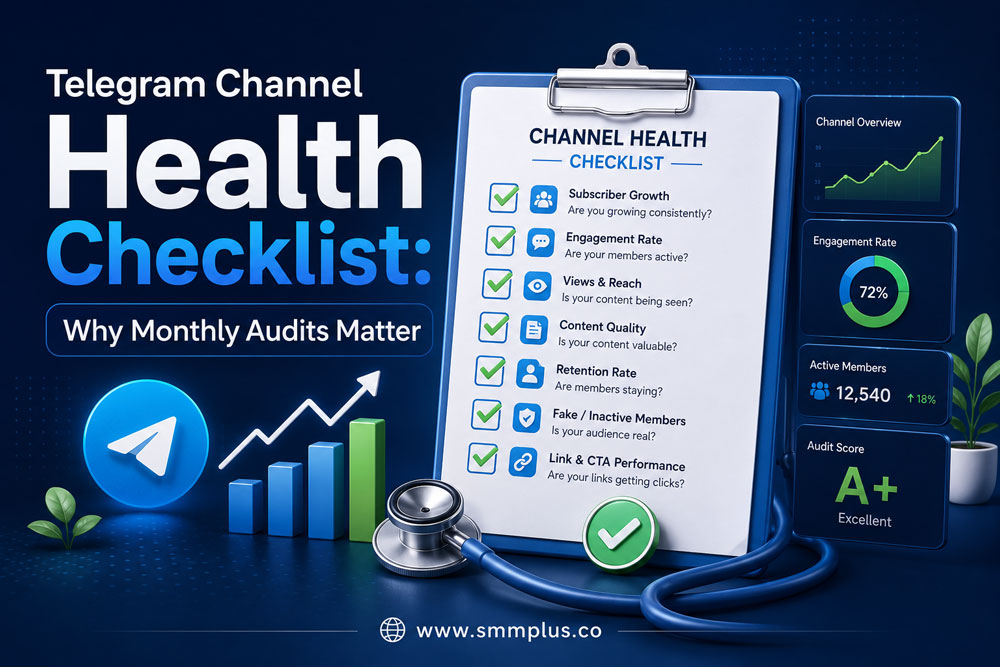
A channel can have thousands of members and still be underperforming — if the audience is inactive, posts aren’t reaching people, or engagement is weak, the subscriber count alone won’t tell you that. A monthly health audit catches these problems before they become growth barriers.
What Is a Channel Health Audit (vs. Just Checking Analytics)?
These get confused often, but they answer different questions:
| Telegram Analytics | Channel Health Audit |
|---|---|
| Shows what happened | Explains why it happened |
| Raw numbers (views, members) | Diagnosis + action plan |
| Tracks past results | Builds a plan for what’s next |
Analytics might show average views dropped 30%. An audit asks why — did content quality slip, did posting frequency drop, did the audience go quiet — and turns that into a specific next action. If you haven’t already, our Telegram Growth Metrics guide covers what each individual metric means and how to calculate it; this checklist assumes you know that and focuses on the recurring process of auditing them.
A real risk this catches: a channel gains 10,000 members in a month and looks like a clear win — until an audit shows most of those members are inactive, views didn’t move, and reaction rates actually dropped. Without the audit, that channel owner keeps chasing the wrong number.
How Often Should You Audit?
| Channel Type | Frequency | Why |
|---|---|---|
| New channel | Every 2 weeks | Audience and content strategy are still forming — you need faster feedback |
| Established, growing channel | Monthly | The standard cadence for most creators and businesses |
| Business/sales channel | Weekly or monthly | Performance ties directly to leads and revenue, so tighter monitoring pays off |
The 5 Areas a Complete Audit Covers
- Audience Health — is your member base growing and staying active, or just growing?
- Engagement Performance — views, reactions, and how consistently they hold across posts (not just your best ones).
- Content Performance — which topics/formats work, which don’t, and why.
- Trust & Discoverability — how your channel looks to a first-time visitor, and whether people can find it at all.
- Growth Opportunities — what to actually do with everything you just found.
For the mechanics of areas 1–2 (growth rate formula, view-to-member ratio, engagement/reaction rate), see the Growth Metrics guide. Below are the parts of an audit that guide covers doesn’t — the checklist-specific work.
Auditing What the Metrics Guide Doesn’t Cover
Retention, Not Just Growth
Compare new subscribers against unsubscribes every month, not just the net number.
Example: 3,000 new subscribers, 2,400 unsubscribes = net growth of only 600. Acquisition is working; retention is the actual problem. This distinction changes what you fix — more promotion won’t help if the channel is leaking members as fast as it gains them.
Discoverability
Can someone find your channel without already knowing it exists? Check:
- Channel name — “Daily Updates” tells a searcher nothing; “Crypto Market Analysis Daily” does.
- Username — short and memorable enough to type or forward.
- Description — answers “what is this, who’s it for, why subscribe” in the first line.
- Pinned post — gives a new visitor a clear next step.
Trust Signals
Visitors decide whether to subscribe within seconds, based on what’s visible: recent activity, view counts, reactions, and how professional the channel looks. Two channels with identical content can convert very differently — one with 50,000 members and 500 views/post, another with 15,000 members and 8,000 views/post. Most first-time visitors read the second one as more active and trustworthy, regardless of the larger raw number on the first.
Boost Status & Bot Activity (if applicable)
If you use Telegram Boost or run a bot, include them in the monthly pass: current boost level and available features; bot starts, new users, and conversion rate. A bot with lots of visitors but few activations usually points to weak onboarding or an unclear call-to-action, not a traffic problem.
Competitor Comparison
Check 2–3 channels in your niche monthly: growth speed, average views, posting frequency, content formats. The goal isn’t copying them — it’s spotting whether a shift in your numbers is channel-specific or a niche-wide trend.
Growth Source Quality
Not all new members are equal. A campaign that brings 5,000 low-activity members is often worth less than one that brings 1,500 highly engaged ones. Track which acquisition sources produce members who actually stick around and interact.
Turning an Audit Into a Health Score
A simple monthly score keeps you from over-reacting to one bad week:
| Category | Score |
|---|---|
| Audience Growth | /10 |
| Member Retention | /10 |
| Views Performance | /10 |
| Engagement Rate | /10 |
| Content Quality | /10 |
| Search Visibility | /10 |
| Social Proof | /10 |
| Conversion Potential | /10 |
Total: /80 — 70-80 is healthy, 50-70 needs optimization, below 50 needs a focused improvement plan. Track it monthly; the trend line matters more than any single month’s score.
From Audit to Action
| What the audit found | What to do about it |
|---|---|
| Members growing, views flat or declining | Content/distribution problem — revisit format and posting consistency |
| Views healthy, reactions weak | Engagement problem — add interactive formats, stronger CTAs |
| New channel, low trust signals | Build initial social proof — members or reactions can help while content matures |
| Established channel, growth plateaued | Acquisition problem — revisit discovery and promotion, not just content |
| Bot getting traffic but few starts | Onboarding/CTA problem, not a visibility problem |
One rule that matters more than any metric: fix one thing at a time and measure the next month before changing something else. Auditing five problems and fixing all five simultaneously means you’ll never know which fix actually worked.
Monthly Audit Template
Audience: Total Members | New Members | Unsubscribes | Growth Rate — each vs. previous month
Engagement: Avg Views/Post | Reaction Rate | Shares | Engagement Rate — each vs. previous month
Content: Best-performing post | Lowest-performing post | Best format | Posting frequency
Then: identify the weakest metric → pick one improvement action → measure next month → repeat.
FAQ
Monthly for most established channels; every two weeks for new channels still finding their content-market fit; weekly for business/sales channels where performance directly affects revenue.
Usually inactive subscribers, weak content-audience match, or reduced distribution — an audit that separates growth from retention and content performance will tell you which.
Depends on what your audit shows. Good content but limited reach → prioritize views. Weak audience size overall → prioritize members. Guessing without the audit data usually means fixing the wrong thing.
There’s no universal number — it depends on niche, channel size, and content type. Track your own trend monthly rather than comparing to a generic benchmark.
The Bottom Line
A channel doesn’t become healthy by collecting more members — it becomes healthy by knowing, every month, whether growth, retention, engagement, and trust are actually improving together. The audit is what turns raw numbers into a specific next action instead of a guess.